
From Conclusions to Claims: Bursting EdTech’s Impact Bubble (Part 2)
Masking with medians, survey spin and the fragile authority of numbers. Unpacking in-house research behind a powerful edtech marketing claim.
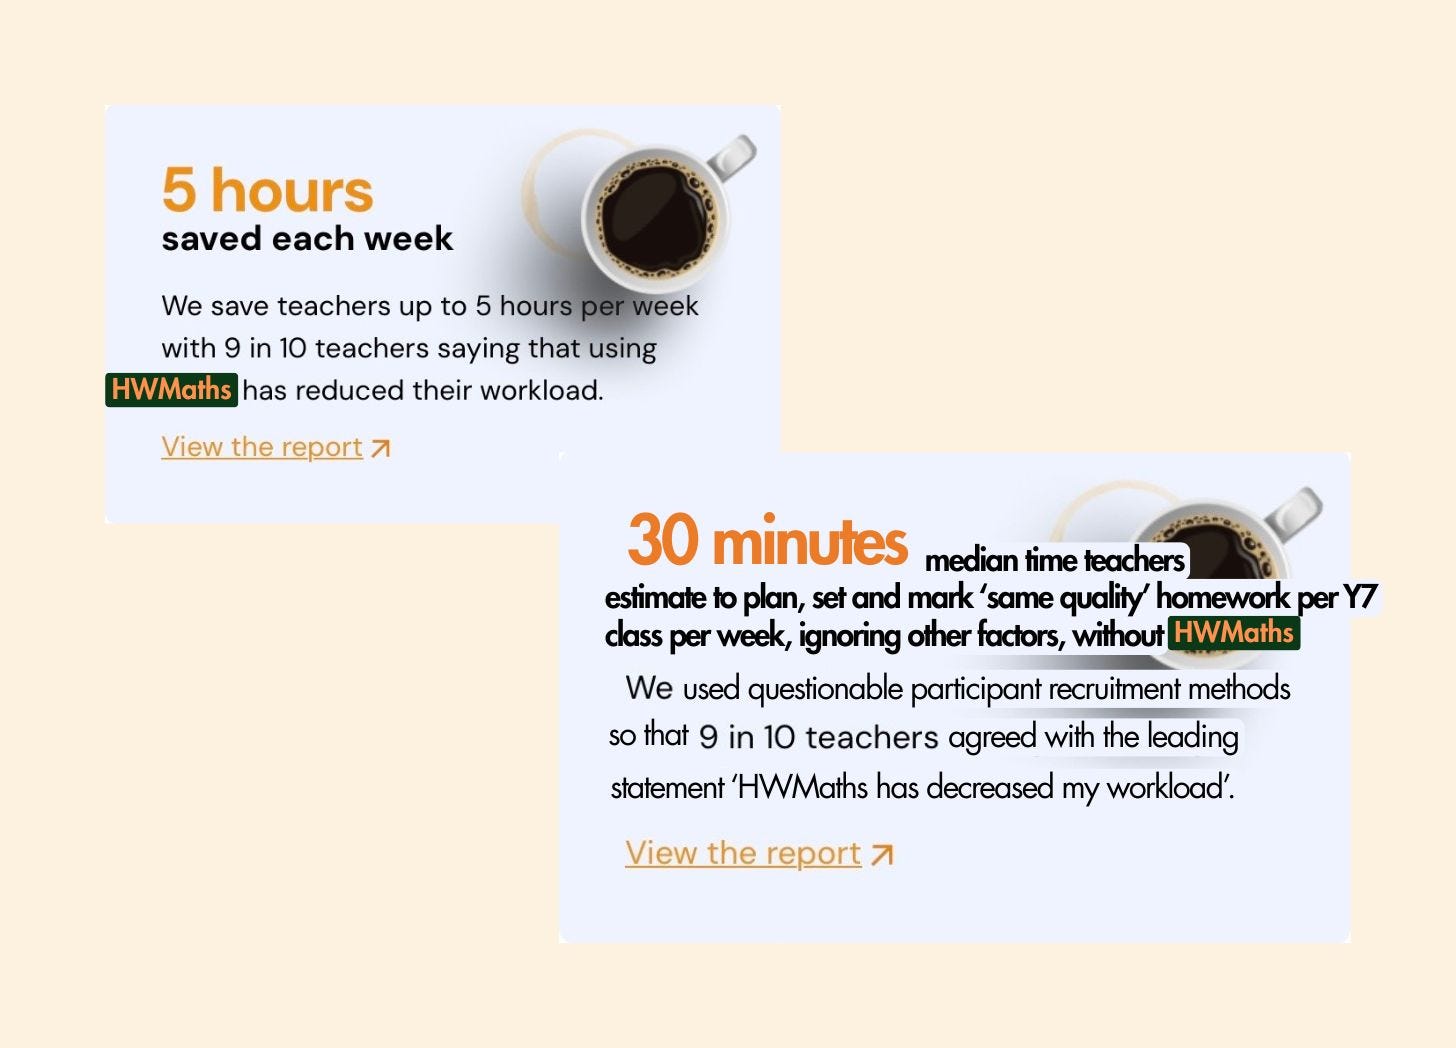
We save teachers up to 5 hours per week
83% more progress with just 15 minutes of practice every week.
1 hour significantly improves grades.
From a marketing perspective, these are the perfect soundbites of edtech impact.
Powerful numbers.
Proof.
Clearly, it works - this maths homework platform we’ll call HWMaths is used by over half of UK secondary schools (or so they say…)
Here’s the ethical dilemma:
Most of those claims are a big leap from the report conclusions.
Or to put it less gently, they’re misleading - even the research they’re based on is highly flawed.
Yet they brazenly showcase their “evidence” right under the claims.
And they’re not alone.
Shockingly, this is pretty much what “good” looks like in terms of edtech evidence (for now).
The sector is shifting away from marketing claims based on dodgy research or engagement data - for good reason.
In this edition, you’ll see why!
We’ll unpack HWMaths’ claim ‘We save teachers up to 5 hours per week’ to see how bad research can look so good1
This is Part 2 of a series for Founders and CEOs wondering whether evidencing the impact of educational products is worth it - or even feasible.
Catch up on Part 1 here:

Don’t miss these 10-minute nuggets explaining EdTech’s Impact Illusion in straightforward language.
Survey Spin
The 5 hour/week claim started life as a four-question survey:
Q1 asks teachers whether their workload was reduced, unaffected or increased by using HWMaths, based on their most recent full working week (including evenings, weekends etc), listing all the categories used in standard UK workload surveys.
No drama so far, but this is important later.
To get to the headline figure, HWMaths uses responses to the next two questions:
Q2 - To what extent do you agree or disagree with the following statement:
Overall using HWMaths in school tends to decrease my workload-

Strike One: priming for the response you want
Choose one of:
Strongly Agree
Agree
Disagree
Strongly Disagree
Strike Two: no option for ‘Neither Agree Nor Disagree’ forces teachers to choose Agree or Disagree.
Next, Q3:
Thinking about lesson planning/preparation and homework setting/marking, if you did not have HWMaths, how many more (if answer to 4 was agree or strongly agree), or less (if answer to 4 was disagree or strongly disagree) time would you need to spend to achieve the same quality level? Please express this as minutes per class per week.
This phrasing asks teachers to only evaluate HWMaths on categories where it expects to save time.
This isn’t bad in itself - pretty useful for the company to know whether it’s having the intended effect on the areas where it’s aiming to reduce workload.
Except the category data from question one destroys the validity of using these figures to equal “time saved” in general.
Teachers said various categories increased workload, including pupil discipline.
The authors spin this up as ‘slightly surprising’ and explain the finding away by saying ‘the system… empowers teachers… to monitor and enforce things like homework completion.’
This is the farce of Saves Teachers Time in action - often not saved, but redirected.
Another issue is the meaning of ‘quality’.
A teacher might think back to badly formatted worksheets and interpret quality as polished, professional design that would take them ages to replicate.
Strike three: estimating against a subjective, poorly-defined standard.
So many gif options, post the one in your head right now! No but really, is this making sense? Let me know.
Masking with a Median
Averages always obscure detail.
In the time question, some teachers estimated spending 60 minutes less per class per week without HWMaths. It isn’t saving those teachers time.
On the other end, a few poor souls would have spent 240 minutes more per class per week.
Wild. Perhaps they had an awful marking policy before using the platform, but we just don’t know (and that’s the problem).
Some reported 0 minutes, proving there should have been an option to Neither Agree Nor Disagree, while the most common choices were 15 mins and 60 mins, with 15 responses each.
That’s important too - we’re not talking huge numbers of teachers here!
Humans are very bad at estimating time individually. This is how national workload surveys are done, but only because they have huge numbers of responses.
Most estimates were somewhere between -1 hour to +2 hours.
The median of +30 mins hides both the teachers who would spend an hour less per class per week to achieve the same quality and the teachers who would spend a lot more time without HW Maths.
So they could say:
Teachers estimated spending 30mins more per class per week (median, range: -60 to 240mins) to achieve the same quality of lesson planning & preparation and homework setting & marking without HWMaths (ignoring increased detentions and meetings).
That… doesn’t have quite the same ring to it as ‘We save teachers 5 hours per week.’
Appearing Authoritative
Extrapolating 30mins per class per week to (up to) 5 hours per week is a common marketing tactic that makes numbers more relatable.
30 minutes per class per week requires individual teachers to make sense of it themselves, by multiplying their number of classes by 30 minutes.
If you had 10 classes, you would think, ‘Oh so it saves me 300 minutes per week…’
It’s difficult to estimate this amount of time in minutes.
I know I’d think, ‘300 minutes doesn’t sound like that much.’
But 5 hours? Sign me up!
Here’s where I feel a tension between my multiple professional identities.
That sounds like a disorder… disorderly it may be, but it’s why I’m good at what I do!
Science Teacher wants accuracy - already in tatters from the method and median debarcle
Policy Researcher recognises that as numbers become more abstract, they become less questionable, more powerful, with fragile authority2
EdTech Marketer sees the human psychology in persuasion by numbers, the competitive marketplace and other companies using tactics like these to get ahead!
Okay so this is a bit of a cop-out, but if the research design hadn’t been avoidably biased towards responses from a small sample of motivated, active users.…
Brief interlude: There were other issues including incentivising speed and completion by the whole department to win a ‘generous hamper’ and only giving one week to respond during the last week of half term.
I mean come on, if you felt a platform was wasting your time, would you open an email (let alone fill in their survey) sent on the Tuesday before half term?
…if estimates of time saved clustered around ‘30 minutes’ without asking teachers to imagine-away negative effects…
…and the ‘10 classes per week’ multiplier was at least actually justifiable (there’s no source for 10 classes per week and the report notes planning time likely varies by year group, but they multiply it anyway)
Well then - and without the pretence of independent authorship - I’d consider saying
‘We save teachers 5 hours per week, on average, based on our own survey of active HWMaths users.’
But as it is, I’d have to settle for this instead…
Don’t miss these 10-minute fortnightly nuggets explaining EdTech’s Impact Illusion in straightforward language.
What You Can Do Today
Audit your own claims:
Find the most compelling statistic you use to sell or market your product.
Look at the study or data behind it and write the non-marketing conclusion e.g. greater use of the platform was associated with increase in predicted grades of Y7 and 8s.
Does the conclusion really match the marketing claim?
If it’s been multiplied to make it bigger (or smaller), can you justify that?
Is the data or report it’s based on easily accessible for review? If not, why not?
If you need help…
Hi, I’m Rebekah 👋 I help education companies clearly communicate their value in ways that resonate with (and don’t mislead!) buyers in schools. I work with mission-driven education companies develop consistent, coherent messaging.
Piattoeva, Nelli & Boden, Rebecca. (2020). Escaping numbers? The ambiguities of the governance of education through data. International Studies in Sociology of Education. 29. DOI: 10.1080/09620214.2020.1725590.